What is Depreciation? The Lemon Car Story 🍋🚗
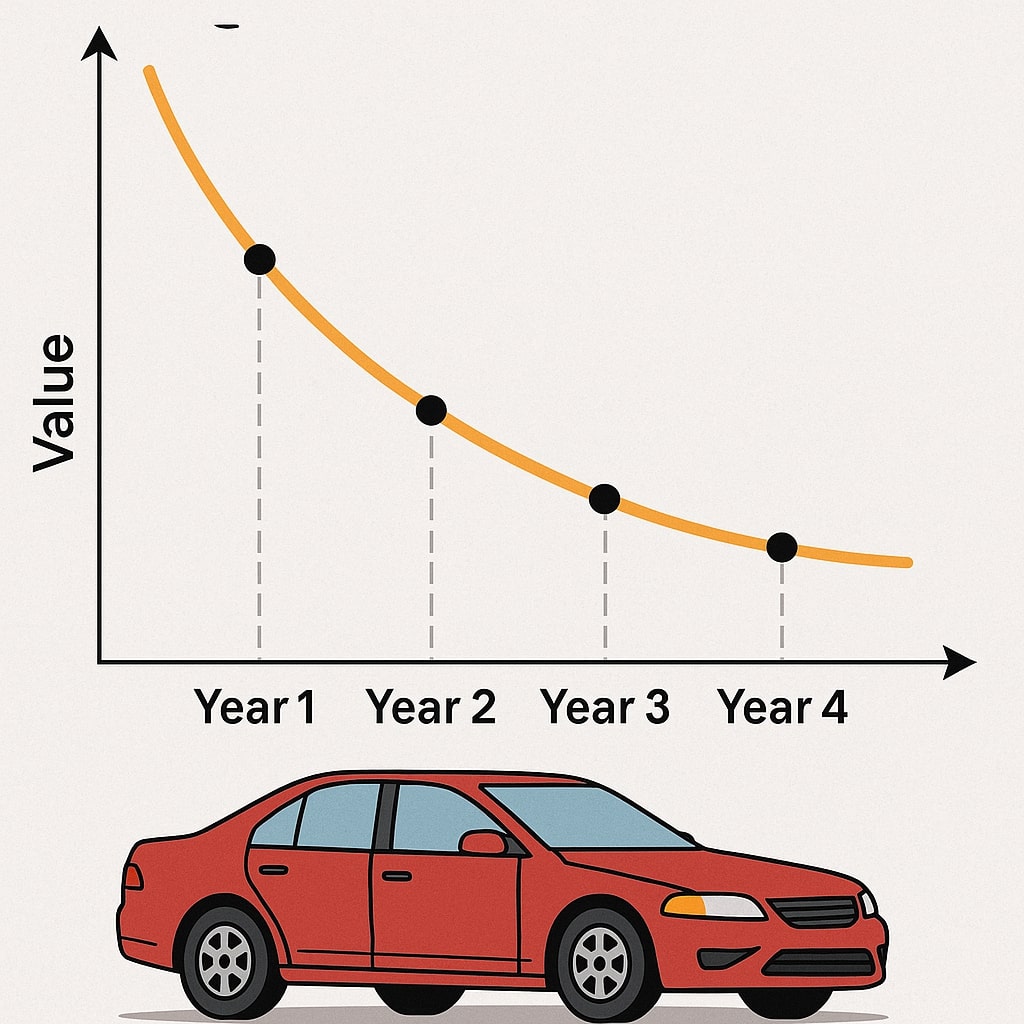
magine buying a brand-new car for ₹5,00,000. After 1 year, it’s worth ₹4,00,000. After 5 years, maybe ₹2,00,000. This value drop? That’s depreciation!
In Simple Terms:
Depreciation = Cost of Asset – Scrap Value
Spread over the asset’s life
Why it matters:
- Shows true profit (revenue – expenses)
- Displays accurate asset value in balance sheet
- Tax savings (depreciation is tax-deductible)

Two Main Methods: Meet SLM & DBM!
Think of depreciation methods like two ways to eat a chocolate bar:
| Method | Straight Line (SLM) | Diminishing Balance (DBM) |
|---|---|---|
| Style | Equal bites every day | Big bites first, small later |
| Best For | Buildings, furniture | Phones, cars, machinery |
| Calculation | Simple division | Percentage of remaining value |
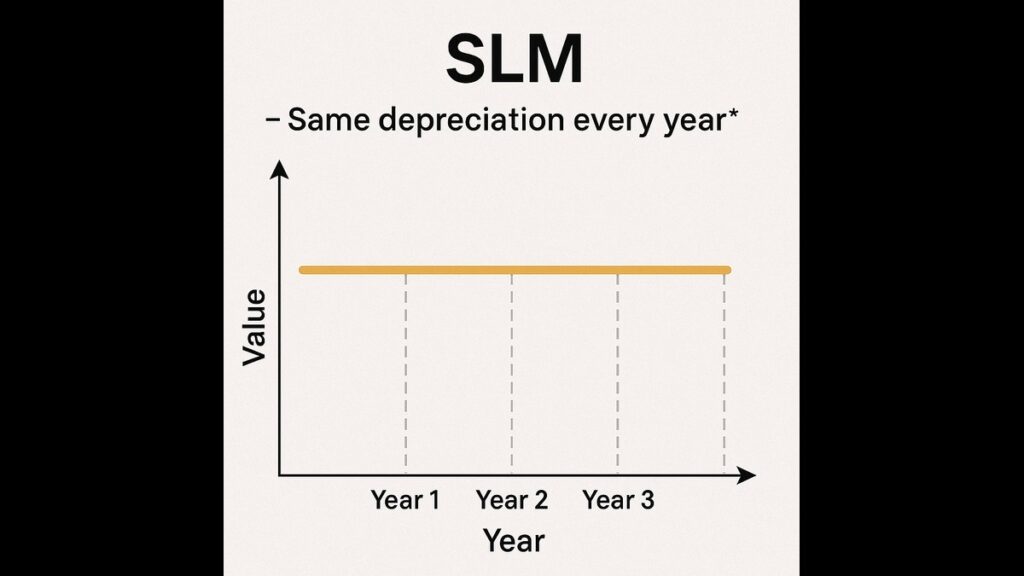
1. Straight Line Method (SLM): The Easy One!
How it works:
- Same depreciation amount every year
- Simple formula:
text
Copy
Download
Annual Depreciation = (Cost - Scrap Value) ÷ Useful Life
Example: Buying a printer for your college project:
- Cost: ₹20,000
- Scrap Value (after 5 yrs): ₹5,000
- Useful Life: 5 years
Calculation:
text
Copy
Download
= (20,000 - 5,000) ÷ 5
= ₹3,000 per year
Yearly Breakdown:
| Year | Depreciation | Remaining Value |
|---|---|---|
| 1 | ₹3,000 | ₹17,000 |
| 2 | ₹3,000 | ₹14,000 |
| 3 | ₹3,000 | ₹11,000 |
| 4 | ₹3,000 | ₹8,000 |
| 5 | ₹3,000 | ₹5,000 (scrap) |
✅ SLM = Equal slices every year!

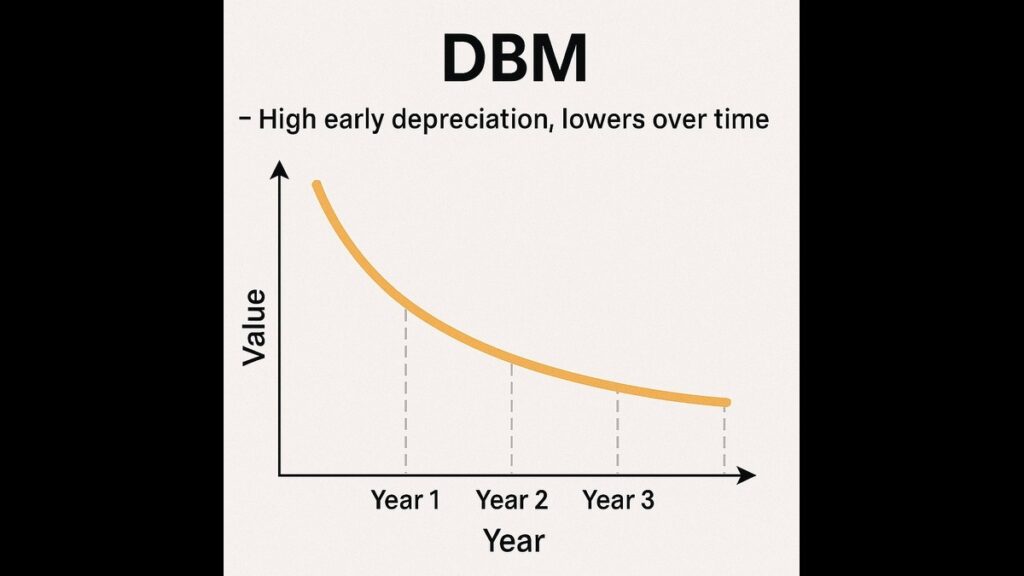
2. Diminishing Balance Method (DBM): The Front-Loaded Way!
How it works:
- Higher depreciation in early years
- Lower depreciation later
- Formula:
text
Copy
Download
Annual Depreciation = Current Value × Fixed %
Example: Same ₹20,000 printer
- Depreciation Rate: 30% per year
Yearly Breakdown:
| Year | Start Value | Depreciation (30%) | End Value |
|---|---|---|---|
| 1 | ₹20,000 | ₹6,000 (30% of 20k) | ₹14,000 |
| 2 | ₹14,000 | ₹4,200 (30% of 14k) | ₹9,800 |
| 3 | ₹9,800 | ₹2,940 (30% of 9.8k) | ₹6,860 |
| 4 | ₹6,860 | ₹2,058 | ₹4,802 |
| 5 | ₹4,802 | ₹1,441 | ₹3,361 |
✅ DBM = Big bites first, small bites later!

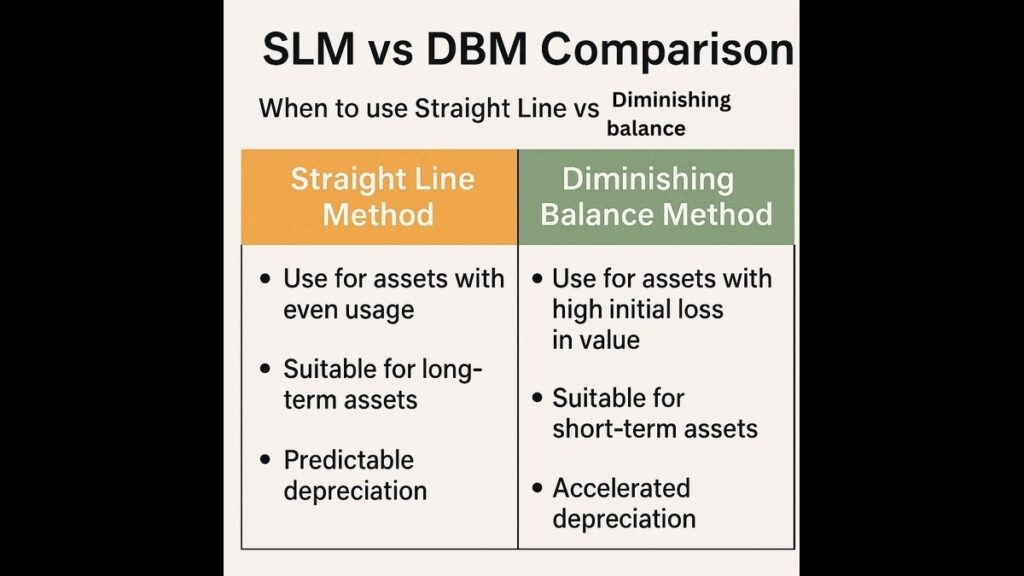
SLM vs DBM: Which to Use?
Choose SLM when:
- Asset loses value evenly (like furniture)
- You want simple calculations
- Scrap value is predictable
Choose DBM when:
- Asset loses value fast initially (like phones)
- You want tax benefits early
- Technology becomes outdated quickly
Real-Life Examples:
| Asset | Best Method | Why? |
|---|---|---|
| Office Building | SLM | Ages evenly |
| Laptop | DBM | Loses value fast |
| Printer | SLM | Simple to calculate |

Practice Problems (Solve Like a Pro!)
Problem 1 (SLM):
You buy a camera for ₹50,000.
Useful life: 5 years
Scrap value: ₹10,000
Calculate yearly depreciation.
Solution:
text
Copy
Download
= (50,000 - 10,000) ÷ 5
= ₹8,000 per year
Problem 2 (DBM):
A machine costs ₹1,00,000.
Depreciation rate: 25%
Calculate depreciation for Year 1 & 2.
Solution:
- Year 1: 1,00,000 × 25% = ₹25,000
- Year 2: (1,00,000 – 25,000) × 25% = ₹18,750
3 Exam Golden Rules
- SLM Formula:(Cost – Scrap Value) ÷ Years
- DBM Formula:Current Value × %
- Scrap Value:
- Always subtract in SLM
- Not subtracted in DBM (uses percentage)
Why This Matters in Real Life
- Businesses: Show true profits
- Tax Savings: Higher depreciation = lower taxable income
- Investors: See accurate company value
💡 Fun Fact: Companies switch methods to save taxes!
Conclusion
Master both methods to:
- Ace accounting exams 📚
- Make smart business decisions 💼
- Save money on taxes 💸
Final Tip: In exams, ask: “Is the asset losing value evenly or fast initially?” That decides SLM or DBM!
